The 2026 El Niño has tied the all-time record for daily strength. Washington Post meteorologist Ben Noll's analysis of NOAA's OISSTv.2.1 sea-surface data, calculated using the ONI convention, puts the daily Niño 3.4 anomaly at 3.07°C, level with the strongest daily reading ever recorded. On September 20, Noll had reported the September 19 reading at 3.05°C above average, breaking the record set in November 2015. The event is still months from its expected peak.
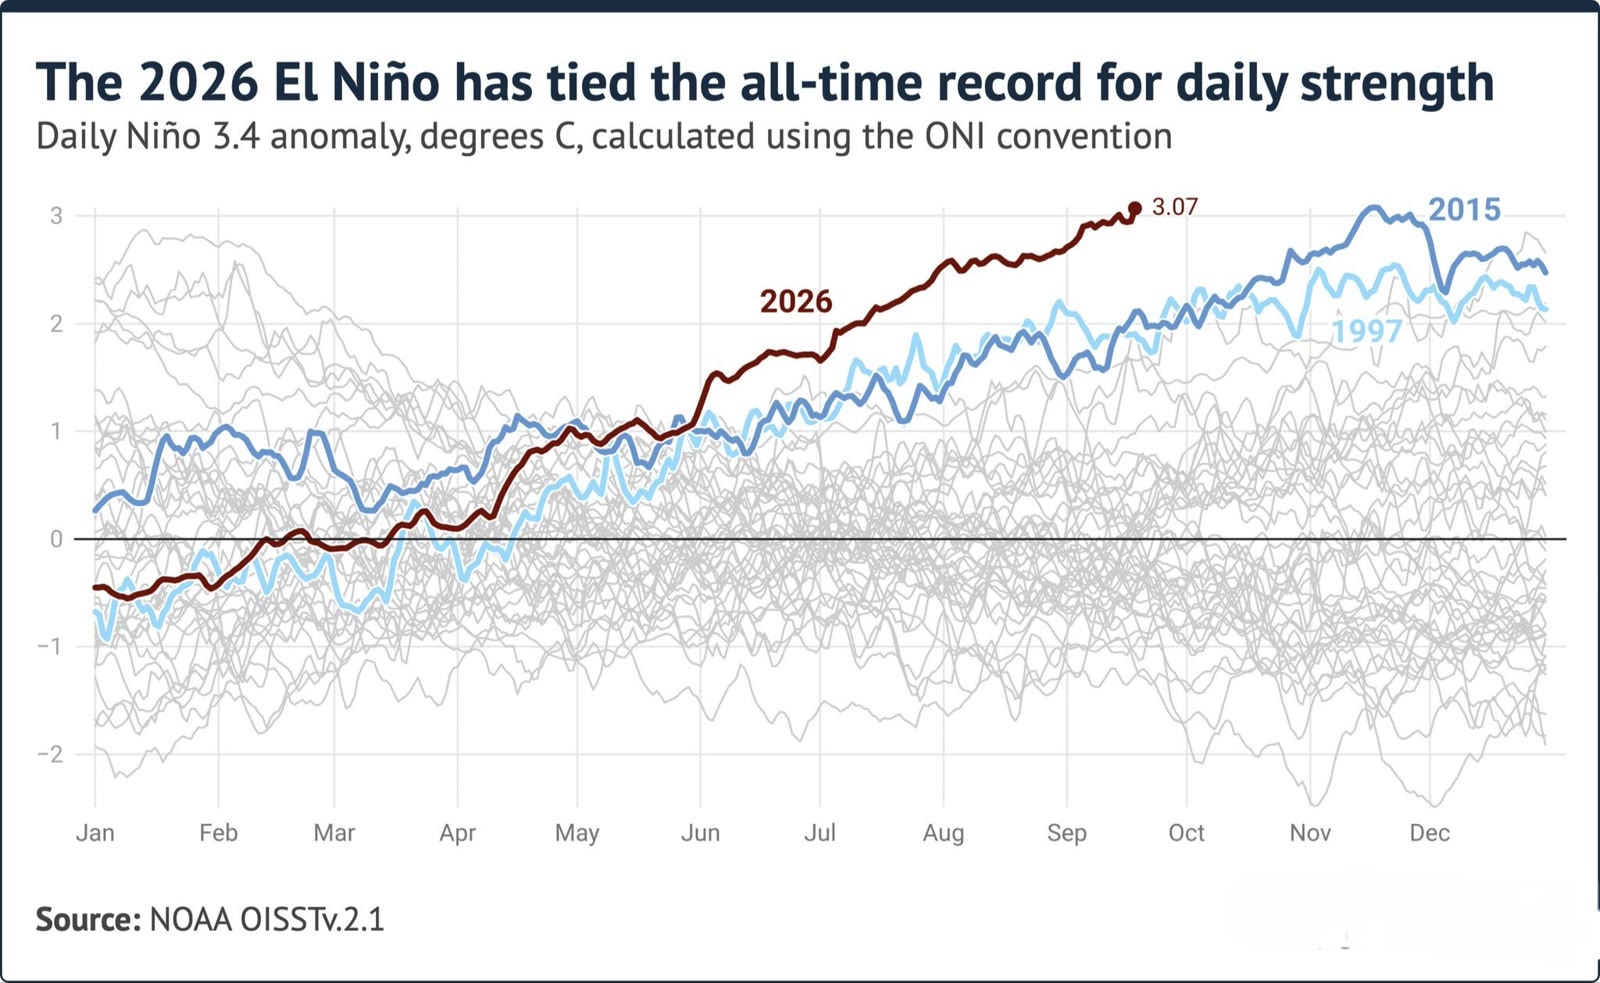
NOAA's Climate Prediction Center, in its latest ENSO discussion, says El Niño is strengthening, with a greater than 90% chance of a very strong event during the Northern Hemisphere fall and winter of 2026-27. August's Niño-3.4 index stood at +1.8°C, and NOAA puts a 75% chance on the October-December 2026 season reaching a historic three-month RONI value of at least +2.5°C, which would exceed the strength of previous El Niño events dating back to 1950. NOAA's weekly sea-surface file put the week centered September 16 at 29.6°C, a +3.0°C weekly anomaly. Note the bookkeeping: daily, weekly, and three-month indices measure different things over different periods and are not interchangeable.
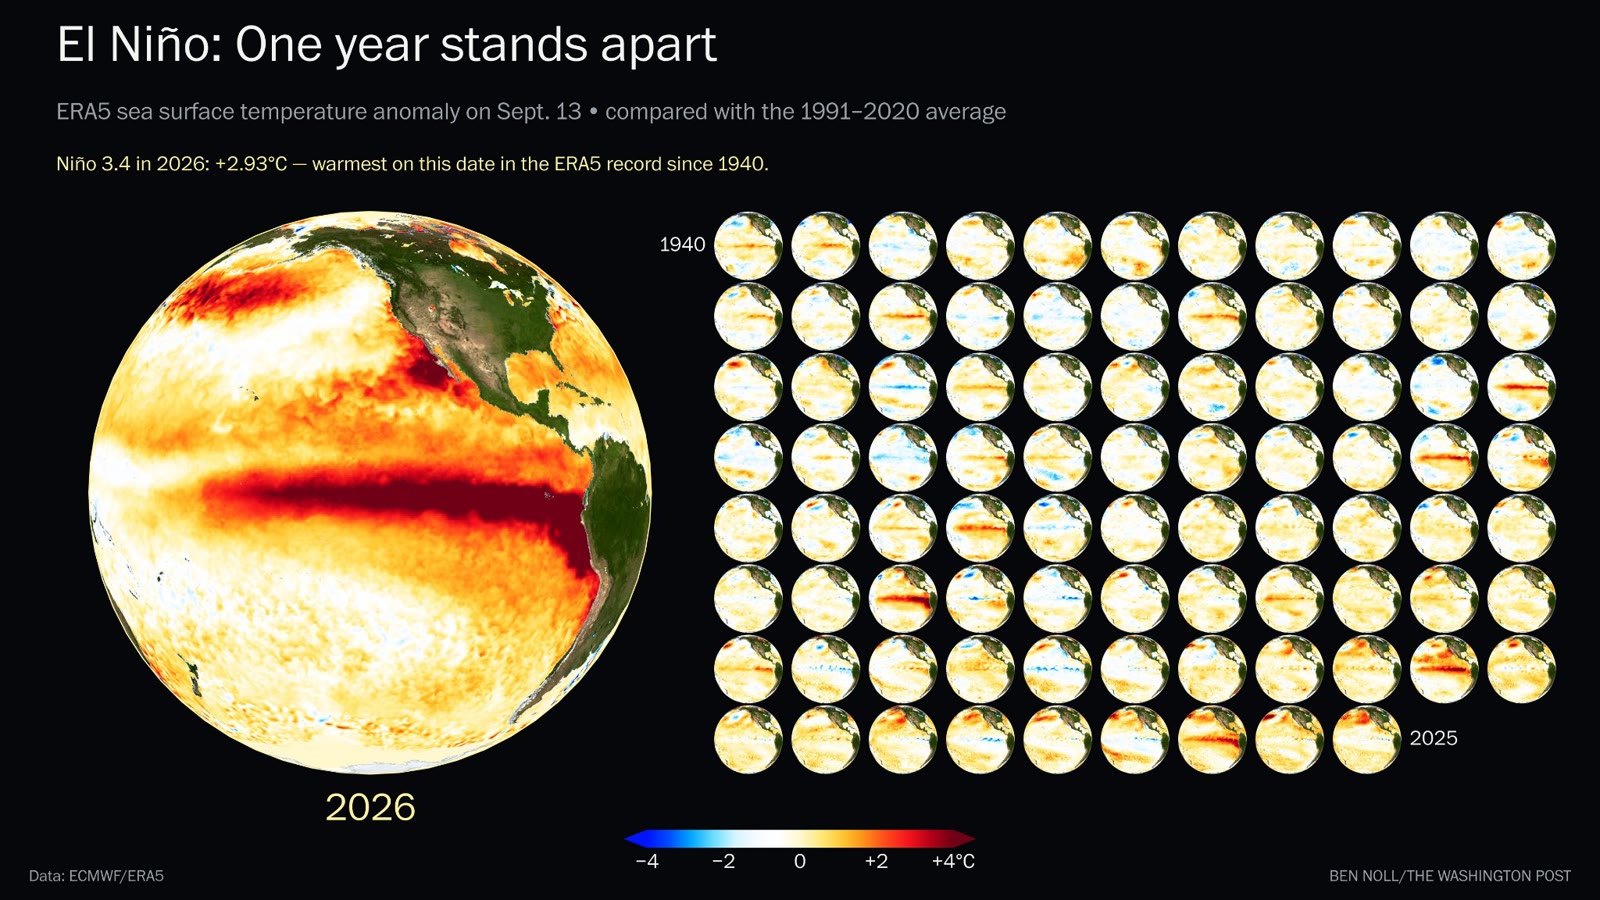
One year stands apart
A second Noll graphic, built on ECMWF's ERA5 reanalysis, compares September 13 sea-surface temperature anomalies against the 1991-2020 average for every year from 1940 to 2025. On September 13, 2026, the Niño 3.4 region sat at +2.93°C, the warmest reading on this calendar date in the ERA5 record going back to 1940. In an 86-year grid of small globes, no other year comes close to the depth and breadth of the 2026 warm tongue.
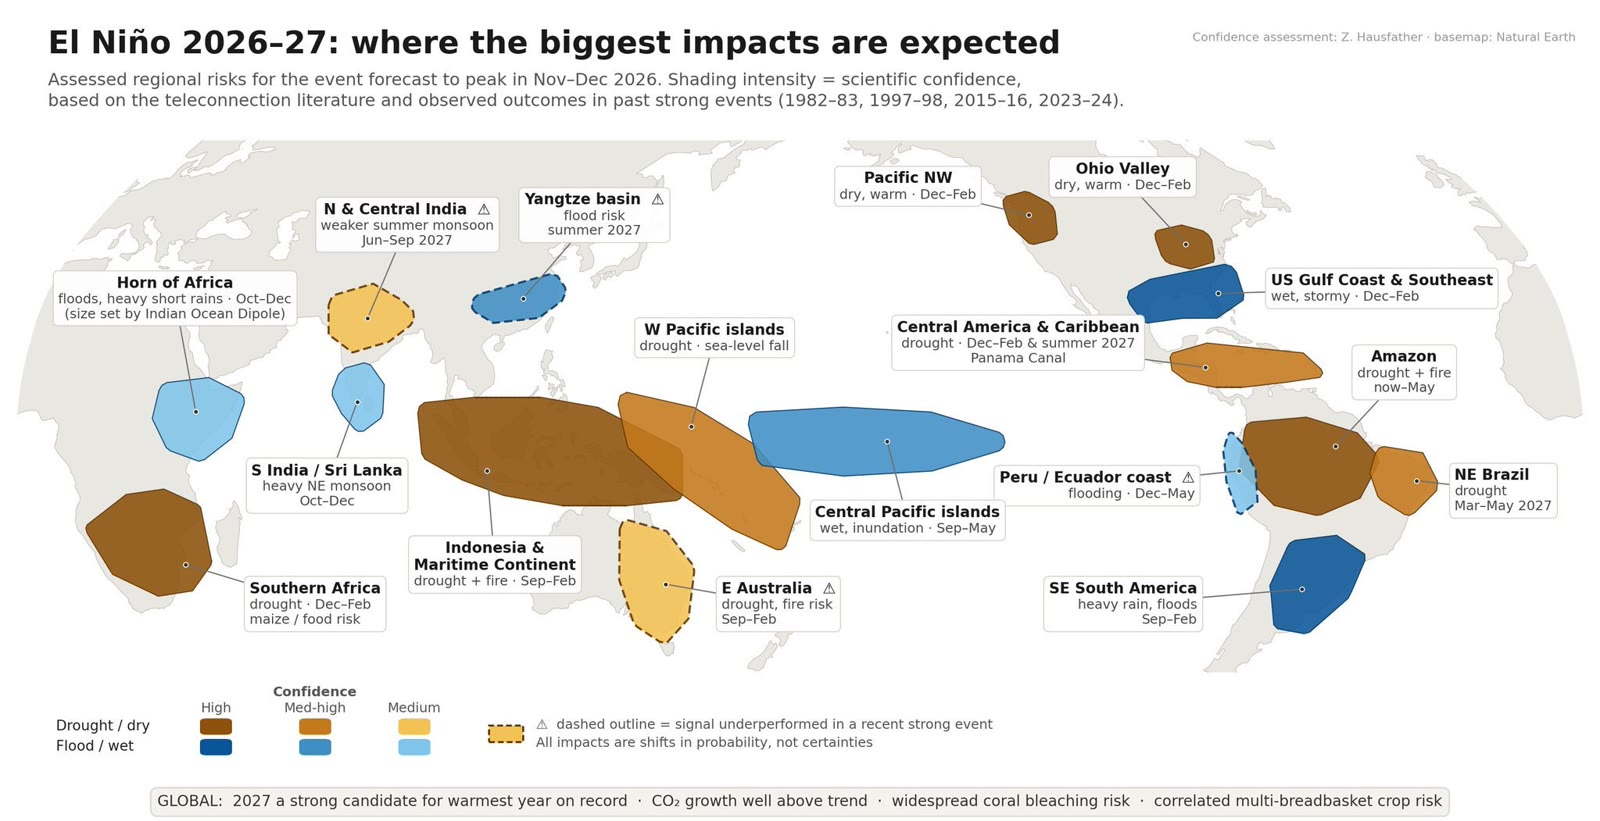
Where the biggest impacts are expected
Climate scientist Zeke Hausfather's assessed regional risks for the event, which forecasters expect to peak in November-December 2026. The assessment draws on the teleconnection literature and the observed outcomes of past strong events (1982-83, 1997-98, 2015-16, 2023-24). Shading intensity marks scientific confidence, and every impact on the map is a shift in probability, not a certainty.
- North and central India: weaker summer monsoon, June to September 2027.
- South India and Sri Lanka: heavy northeast monsoon, October to December.
- Indonesia and the Maritime Continent: drought and fire, September to February.
- Eastern Australia: drought and fire risk, September to February.
- Horn of Africa: floods and heavy short rains, October to December; the scale is set by the Indian Ocean Dipole.
- Southern Africa: drought, with maize and food risk, December to February.
- Amazon and northeast Brazil: drought and fire, now through May 2027.
- US Gulf Coast and Southeast: wet and stormy, December to February.
- Central America and the Caribbean: drought, December to February and summer 2027; the Panama Canal is exposed.
The map's global footer reads like a watch list for next year: 2027 a strong candidate for the warmest year on record, CO2 growth well above trend, widespread coral bleaching risk, and correlated multi-breadbasket crop risk.
The ocean, turning
Ten seconds of the Pacific, rotating: NASA sea-surface temperature anomaly data rendered as a globe. The warm tongue along the equator is the El Niño itself, the red band running thousands of kilometers from South America into the central Pacific.
What it means for Bangladesh
For Bangladesh, the documented El Niño fingerprint is rainfall, not heat alone. A 2021 peer-reviewed study in Atmosphere found El Niño years bring roughly 145 mm less annual rainfall than neutral years, with the statistically significant reductions concentrated in May and October: the pre-monsoon shoulder that sets up planting, and the post-monsoon shoulder that finishes the aman harvest.
The mechanism runs through the monsoon. A weaker South Asian summer monsoon is the canonical El Niño teleconnection for this region, and Hausfather's assessment flags a weaker 2027 summer monsoon for north and central India. For Bangladesh that translates into dry-season pressure: lower river flows, salinity pushing further inland in the southwest, and stress on boro irrigation, the channels a Business Standard feature has traced through a potential super El Niño's compounding of the country's climate crisis.
One honest boundary: none of this is a forecast for a specific district or a specific month. El Niño tilts probabilities; the monsoon has its own variability. What record strength changes is the size of the tilt.
What to watch
Three observables, stated so they can be proven wrong. First, NOAA's monthly ENSO discussion: whether the October-December RONI crosses +2.5°C, the historic threshold. Second, the 2027 summer monsoon: whether north and central India, and Bangladesh with it, come in below normal. Third, global temperature: whether 2027 becomes the warmest year on record, as current forecasts expect.
Sources
- NOAA Climate Prediction Center, ENSO diagnostic discussion (read 23 Sep 2026): cpc.ncep.noaa.gov.
- NOAA weekly sea-surface temperature anomalies, 1991-2020 base period, week centered 16 Sep 2026: cpc.ncep.noaa.gov.
- Graphics: Ben Noll / The Washington Post (data: NOAA OISSTv.2.1; ECMWF/ERA5; NASA), republished with clearance.
- Impacts assessment: Zeke Hausfather (basemap: Natural Earth), republished with clearance.
- theweather.com, "Record-breaking El Niño forecast to strengthen as California declares state of emergency," quoting Noll's 20 Sep 2026 post: theweather.com.
- Gizmodo, "El Niño Is Just a Fraction of a Degree Away From Becoming the Strongest on Record," 16 Sep 2026: gizmodo.com.
- Big3Africa summary of Hausfather's Nature article, 23 Sep 2026: big3africa.org.
- Peer-reviewed Bangladesh rainfall study, Atmosphere 12(11):1449, 2021: mdpi.com.
- The Business Standard, "How super El Niño could compound Bangladesh's climate crisis": tbsnews.net.